728x90
pandas_tutorial_read.csv
0.11MB
[DataFrame]
- DataFrame : 엑셀과 같이, 인덱스(Index), 변수(Column), 값(Value)로 이루어진 데이터 구조
- Pandas DataFrame의 장점
- 대용량 데이터를 빠르고 쉽게 다를 수 있다. 한계용량 : 엑셀 약 100MB / Pandas 1GB ~ 100GB
- 복잡한 기능을 구현하기 쉽고, 데이터 전처리를 쉽게 할 수 있다.
- 다른 시스템과 연동이 쉽다. Flask 라이브러리 : 웹 개발 / SQLAlchemy : 데이터베이스 / Sklearn : 머신러닝
- 리스트를 이용한 DataFrame 생성
import pandas as pd
df = [
[1,2,3],
[4,5,6],
[7,8,9]
]
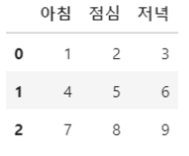
df
#[[1, 2, 3], [4, 5, 6], [7, 8, 9]]
pd.DataFrame(df)

- Column 이름을 리스트 형태로 붙인 모습
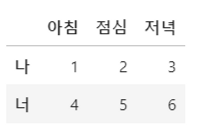
df2 = pd.DataFrame(columns=['아침', '점심', '저녁'], data=df1)
df2
- 인덱스 붙이기
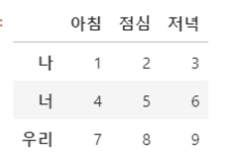
name = ['나', '너', '우리']
df2.index = name
df2

Table Information
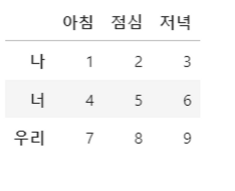
- DataFrame의 3가지 구성요소 : 인덱스(index), 변수(cloumn), 값(Value)
- 데이터 분석 전, 데이터를 파악할 때, 이 3가지 요소에 대해 가장 먼저 확인해 봐야 함
- index와 column은 Pandas Core 형태로 구성, Value는 Numpy의 ndarray로 구성 됨.
- 데이터의 상위 2개의 값만 출려
df2.head(2)
df2.tail(2)

- 특정 Column에 대해 확인
df2['아침']

- 데이터를 index 기준 순서로 정렬하고 싶을 때
df2.sort_index()
- ascending 함수를 이용하여, 오름차순/내림차순 정렬을 할 수 있다.
df2.sort_index(ascending=False)

- 특정 column을 기준으로 정렬할 때
df2.sort_values(by='점심')
Operation
- 연속형 데이터에 대한 기본 통계 연산
df2['아침'].mean()
#4.0

df2['아침'].sum()
#12

df2['아침'].min()
#1

df2['아침'].max()
#7

df2['아침'].max()
#3.0
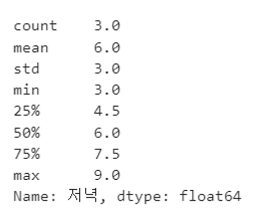
- Describe 함수를 이용한 요약 정리
df2['저녁'].describe()
- 대괄호의 개수에 따라 DataFrame / Series 형식이 결정된다.
type(df2['점심'])
#pandas.core.series.Series

type(df2[['점심']])
#pandas.core.frame.DataFrame
[데이터 불러오기]
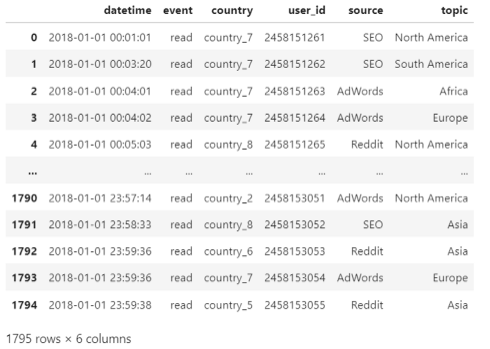
상단의 샘플 데이터를 받아주세요
table = pd.read_csv(r"C:\\Users\\USER\\Downloads\\pandas_tutorial_read.csv", #파일경로
									  delimiter=";", #구분기호로 셀 구분
                    names = ['datetime','event', 'country', 'user_id', 'source', 'topic']) #컬럼명 설정
table
[Pivoting]
- 데이터 분석에 가장 많이 사용되는 함수로, 데이터를 특정 항목에 대해 요약정리 해준다.
- Group by와 Pivot table의 두 가지 기능으로 구현 할 수 있다.
- Group by : 항목 별 값에 대한 결과를 Series 형태로 출력
- Pivot table : 항목 별 값에 대한 결과를 DataFrame 형태로 출력
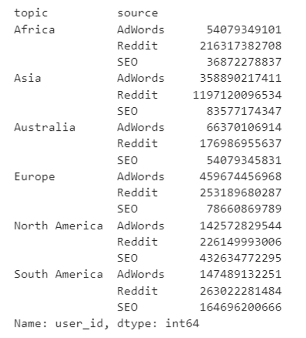
- 특정 Column별 Group by
table.groupby('topic')['user_id'].mean()

table.groupby(['topic','source'])['user_id'].sum()
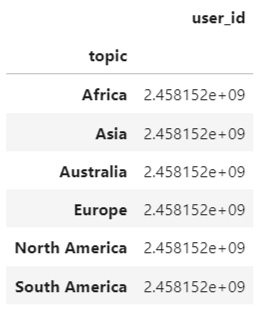
- Picot table 사용, T 함수를 이용해 결과를 row 형태로 정렬
pd.pivot_table(data=table, index='topic', values='user_id')
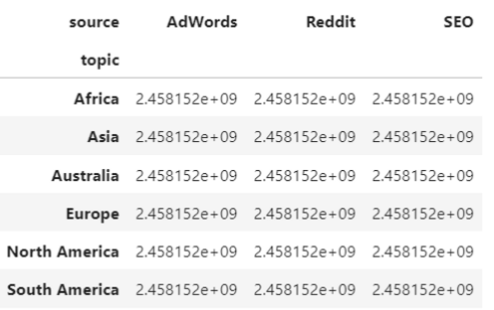
- column에 값을 채워 사용 할 수 있다.
pd.pivot_table(data=table, index='topic', values='user_id', columns='source')
- aggfunc 함수를 이용해, 특정 통계량에 대해 계산 할 수 있다. (합, 최대, 최솟값, 표준편차 등)
pd.pivot_table(data=table, index='topic', values='user_id', aggfunc='sum')

728x90
'python 기초 > [Library]' 카테고리의 다른 글
| Pandas [Series] (0) | 2023.06.27 |
|---|---|
| Numpy (0) | 2023.06.27 |